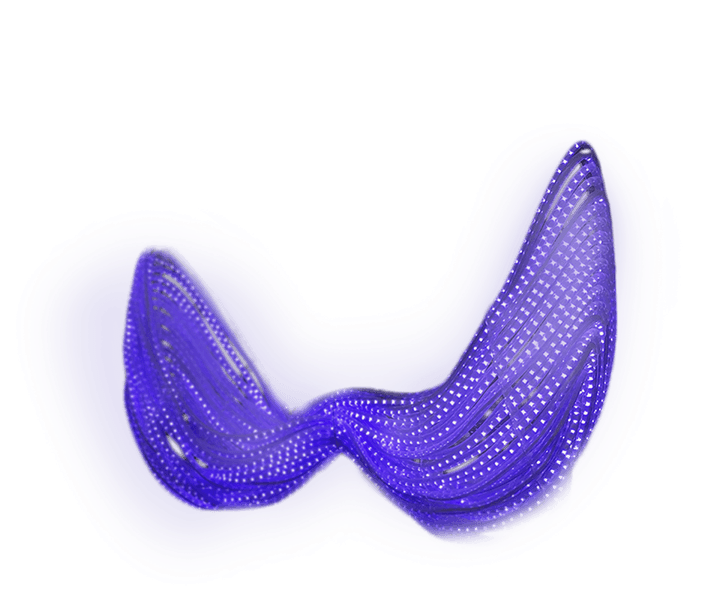
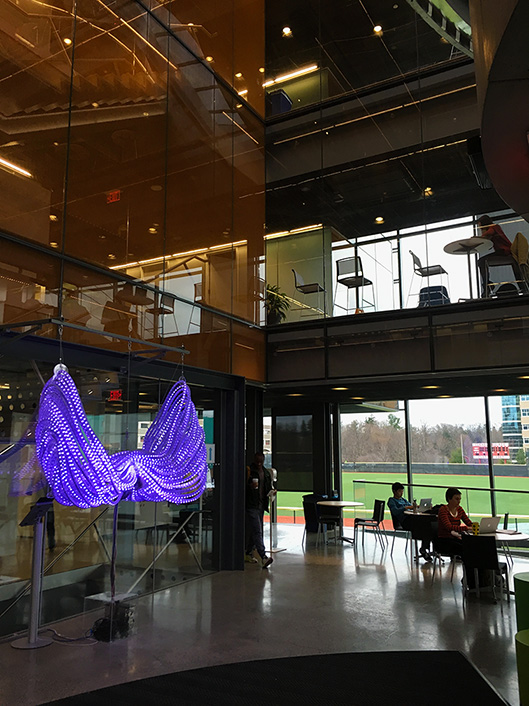
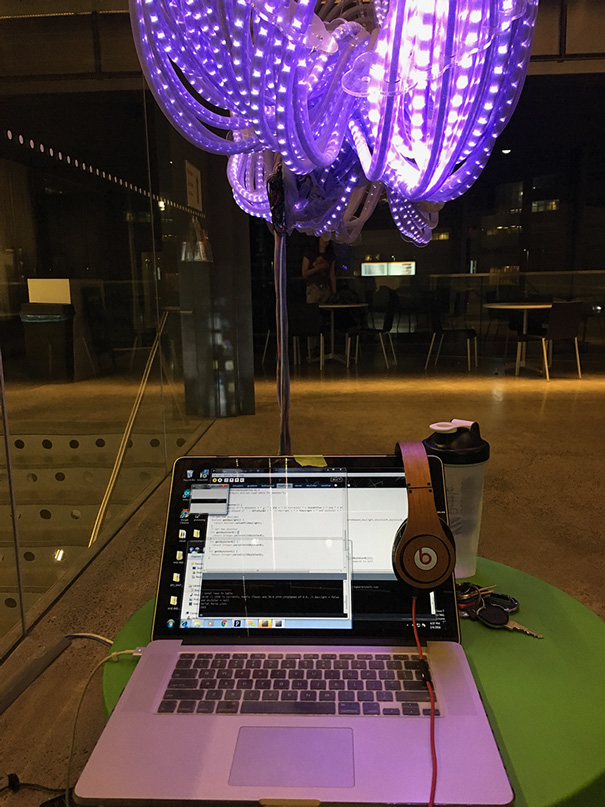
Amongst the bustling students flowing through the atrium of Gates Hall stands a glowing, ebbing mass of entangled lights seemingly suspended in air. This focal piece at Cornell University is part installation and part experiment, examining the fusion of art and technology into one.
Giving new life to stagnant hardware made by a team of university researchers, I created a site-specific installation which drew from its environment to entertain, engage, and inform in an entirely novel way: weather visualization.
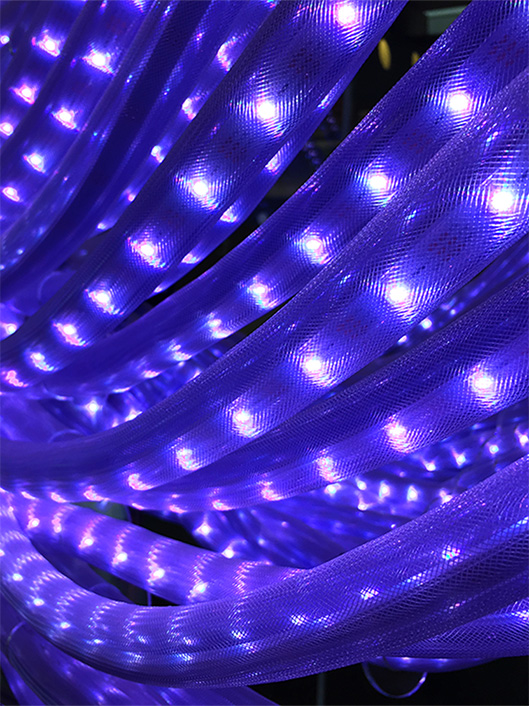
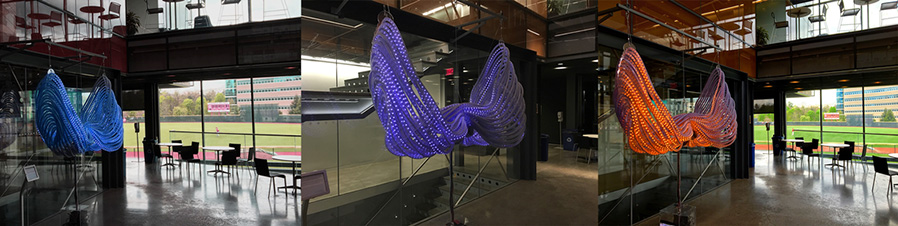
Utilizing real-time data from a campus weathervane and webcam, I formed an interactive installation which presents the current weather conditions through the use of dynamic colors, motions, and effects. As the weather shifts and changes - the piece responds, not only to conditions and temperature but also to external light levels, wind patterns, and sky color.
The resulting piece is one that is tethered closely to a pervasive element of Cornell's campus and character - the ever-changing weather - while representing the interdisciplinary spirit of Cornell's many studies, programs, and colleges. A result of my own pursuit of Fine Arts and Information Science, weather@mood.cloud stands as a work representative of a passion for academic exploration.
Exploratory installation at Cornell University
2015-2016
I have always held great interest in works which, to use a term from the art world, "situate" themselves by evoking, reflecting, or otherwise being derived from the location/environment in which the work is placed.
When presented with the opportunity to breathe new life into the intricate array of LEDs, controllers, and components left in an unresponsive state, I immediately began to explore ideas that could bring significance to the work’s location: the front atrium of Cornell University’s newly constructed Computer and Information Science building, Gates Hall. While monitoring hardware such as cameras and microphones were out of the question due to privacy concerns, there was much potential in the utilization of other localized data sources including activity on the campus network and, as would soon be the focus, weather conditions.
Based in upstate New York, Cornell’s picturesque hometown and campus are known for rolling hills, small-town charm, and heavy winter patterns — often with snowfall occurring as late as May some years. With a range of conditions encompassing everything from beautiful warm summers, crisp autumn days, frigid blustery winters, and a mix of snow and cold rain known endearingly as “Ithacating” in the spring, the weather of Cornell is as important and present a part of every student and faculty’s life as is the work and education.
As I began aligning on the focus of weather, I discovered that gathering local weather data would be made even easier thanks in part to a Cornell-run weathervane stationed on campus. Thus with this knowledge in mind and a concentration selected, I began to heavily modify the existing source code to build something entirely new.
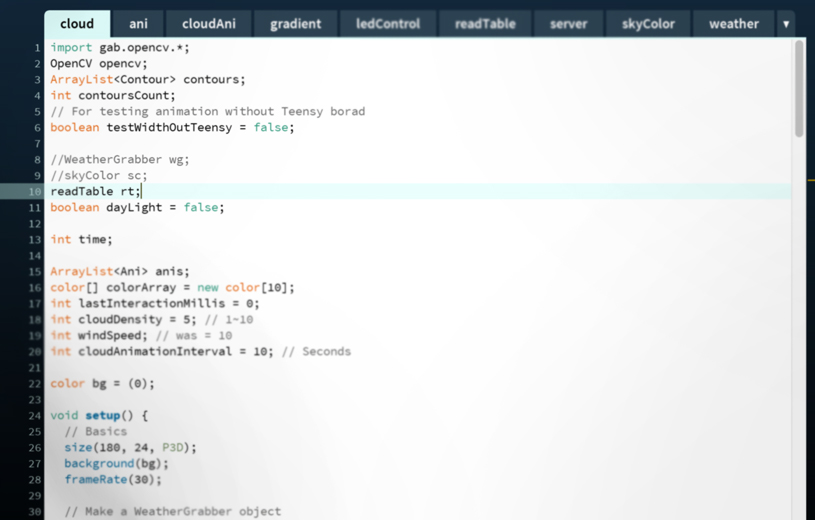
Processing, a programming language built on Java, is an incredibly flexible and lightweight language for quick scripting and testing of creative coding works. I had the opportunity to use Processing in a large series of earlier projects including my Advanced Kinect Drum Kit and #Cornell Pulse (Twitter) work.
Of course, while I was familiar with Processing, I was far from familiar with the hardware-side of the platform. LED arrays, a microcomputer, controllers, network switches - all of which were tightly integrated using Processing code written by students long graduated from their respective programs. Adding to the fun, I was only able to work on the project before 8am and after 7pm due to the work’s highly visible and high traffic location.
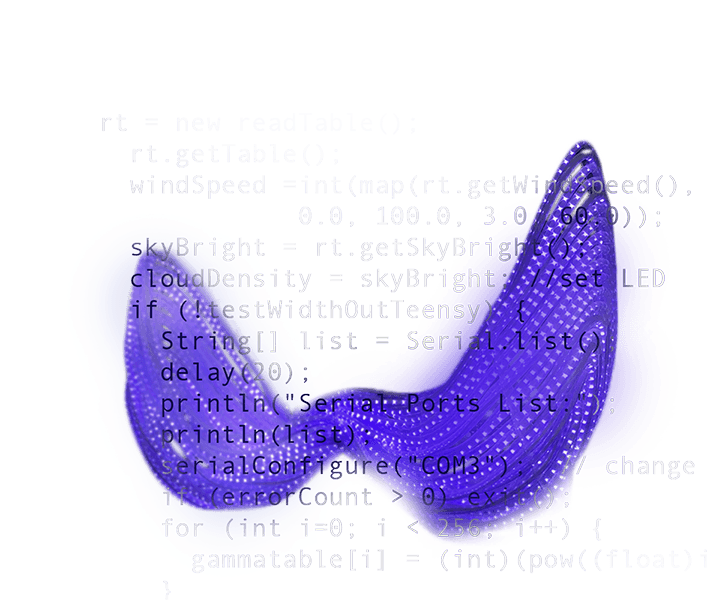
As I began to mentally deconstruct their code in late November, understand the hardware interfaces, and research the best methods for parsing the weather data, I found myself spending a number of deceptively energizing all-nighters incrementally writing and refining my project. With a soft launch date set at the start of the Spring semester, I wanted to make each hour on the platform count during the remaining weeks before departing for Winter session.
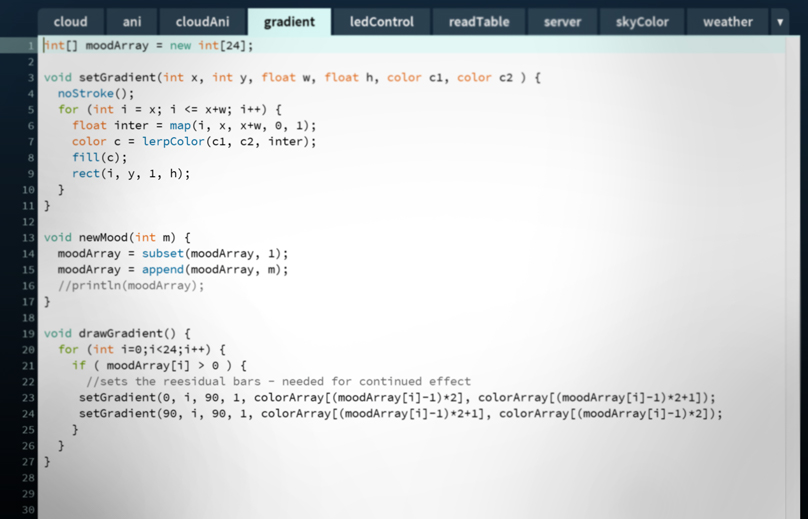
By the end of the Fall semester, I had created something passable: a system which gathered real-time weather data from Cornell’s weathervane connected to WeatherUnderground, translated this raw data into color, luminosity, and motion, and then displayed the end result as an animated display via the multiple LED arrays.
The result, however, was not without issue: the load time of the data scraping script created a significant lag in the animated light flow; the utilization of scraping mixed with a guest network account resulted in the flagging of the system’s IP as malicious; and - most noticeably - a controller error ensured that no matter the actual sky color, the LEDs would always take on a purple hue. Oh, and a rouge error handler made sure that the application would quit if no data could be loaded on the first try. I clearly had my work cut out for me upon return from the Winter break.
Returning early to campus, I hit the ground running - identifying and fixing the mischievous error handler, adding the correct credentials and increasing the scraping timeout to ensure no more network rejections, and then zeroing in on the performance issues.
For the lag, I realized that by separating the scraping process from the animation program I could continue to scrape but instead use a CSV file as a middleman to hold the necessary data for the runtime without causing any lag in the animation of the LEDs. One problem down.
Next, for the issues with LED color, I quickly realized that the existing code foundation had utilized a workaround method to account for the fact that the LED controllers and API were not congruent. A simple alteration to the method brought back the full spectrum, turning the purples to true blues and opening the door to build in color responses to current conditions as well as mirror the range of sky colors.
Cornell features some of the best sunsets over Cayuga Lake thus capturing that was always a small hope of mine throughout the process. In the final days before the official launch of the project I added one final touch - a realtime visualization of the current sky color.
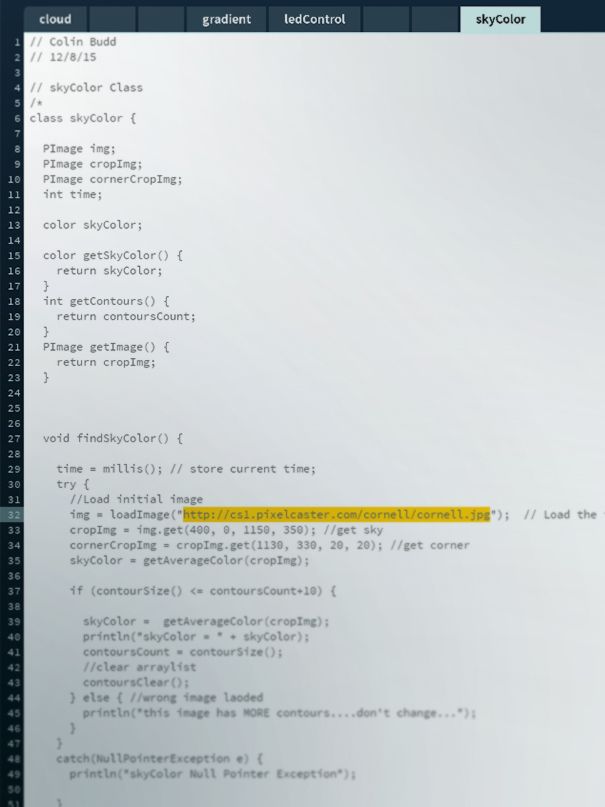
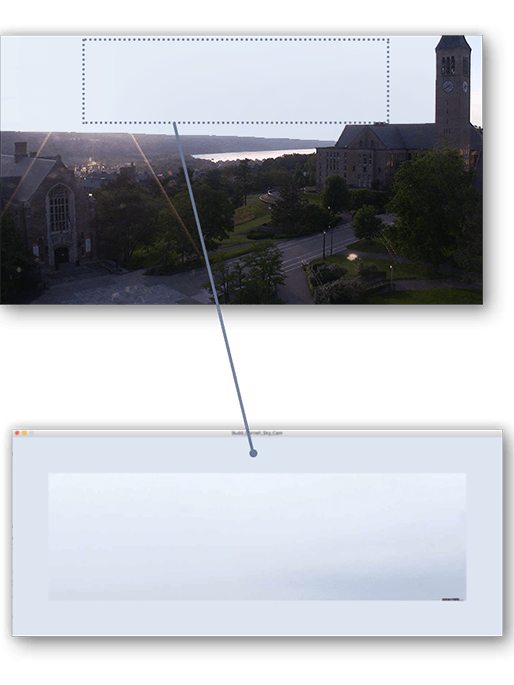
This was accomplished through a bit of resourcefulness and some caffeine over the course of a single night: tapping into Cornell’s publicly accessible Live Cam (which features a cropped and un-cropped view of the same scene), analyzing when the frame featured a segment of the sky, averaging the colors of the sky component to create an aggregate color, and then displaying that color via the LEDs. But, as it would be, since I was working at night, I would have to wait until the next day to determine if my resourcefulness even worked. Fortunately, I arrived the next morning to a pallet of muted blues and, later that day, a mix of magenta to deep red, then finally to purple - the color set designated for night (a choice made not completely undue to the purple LED issue faced during most of the build).
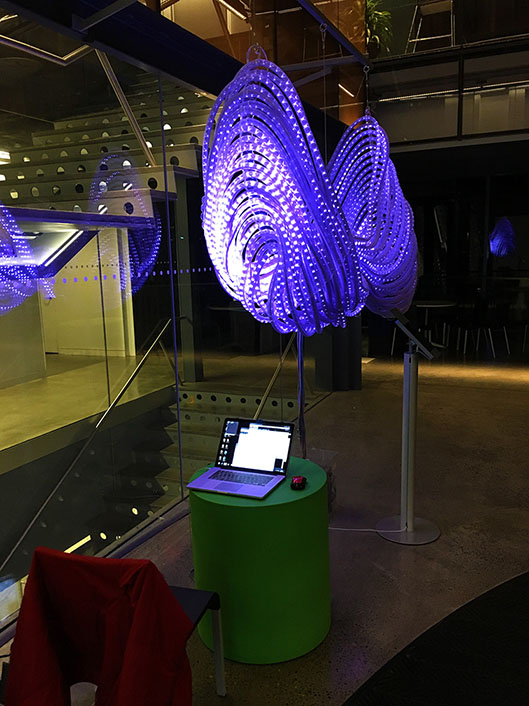
In February 2016, my code went live and the previously stagnant installation began pulsating, ebbing, flowing, and changing colors dynamically in response to the external conditions. My work, weather@mood.cloud was finally live and the result of weeks of nocturnal tinkering was now on display for all to see.
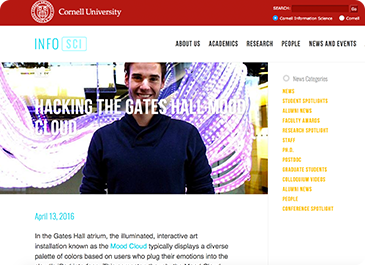
The novel application of injecting weather visualization into a project so central and visible on campus was, expectedly, noticed by the community. Fortunately, the work was met with positive reviews and interest from students, faculty, and organizations into the process behind the work.
Symbolizing the incredible interdisciplinary spirit at Cornell, weather@mood.cloud represents well what is possible through a fusion of multiple backgrounds, perspectives, and studies.
Want to try your hand at building a mood.cloud? Check out the source code + documentation for the latest weather@mood.cloud build on my Github.
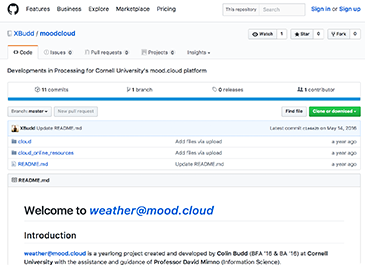